Published Date: December 27, 2023
Validated: Yes
Audience: Everyone
Products and Versions Covered:
- Jama Connect®
IMPORTANT: Access to the REST API is limited to users with a Named Creator Jama Connect license, including endpoints in v1, labs, and SCIM. Users without a Named Creator Jama Connect license, including those with a Creator Float License, do not have access.
Audience: Everyone - System and Org Admins
Summary
System and Organization Admins can monitor float license usage trends and current active logins by navigating to the License page in the Admin section of Jama Connect®.
The license usage chart provides visibility into:
• Real-time license consumption
• Historical trends
• Threshold exceedances
• Downgrades and denials
• Active user sessions
Because floating licenses are shared, active logins may exceed the number of purchased licenses at times. This behavior is expected when licenses are dynamically allocated across users.
Resolution
Monitoring Float License Usage in Jama Connect®
The license usage chart provides the following views:
Daily Overview:
Displays the cumulative float license usage per unique user per day.Hourly View:
Click on any day in the chart to drill into an hour-by-hour breakdown.Minute-Level Detail:
Click again ofic hour again to view usage on a minute-by-minute basis, showing real-time concurrent user activity.
Because floating licenses are shared, the number of active logins may appear higher than the total number of purchased floating licenses—this is expected. Multiple individuals may use the same floating license at different times within the same day or hour.
Setting Usage Threshold Alerts
To proactively monitor float license utilization, Admins can configure email alerts when a specific usage threshold is crossed:
Click the gear icon above the usage chart.
Set your desired usage threshold.
Enable email notifications.
This feature helps Admins identify usage trends, avoid access bottlenecks, and determine if additional floating licenses are needed to support user demand.
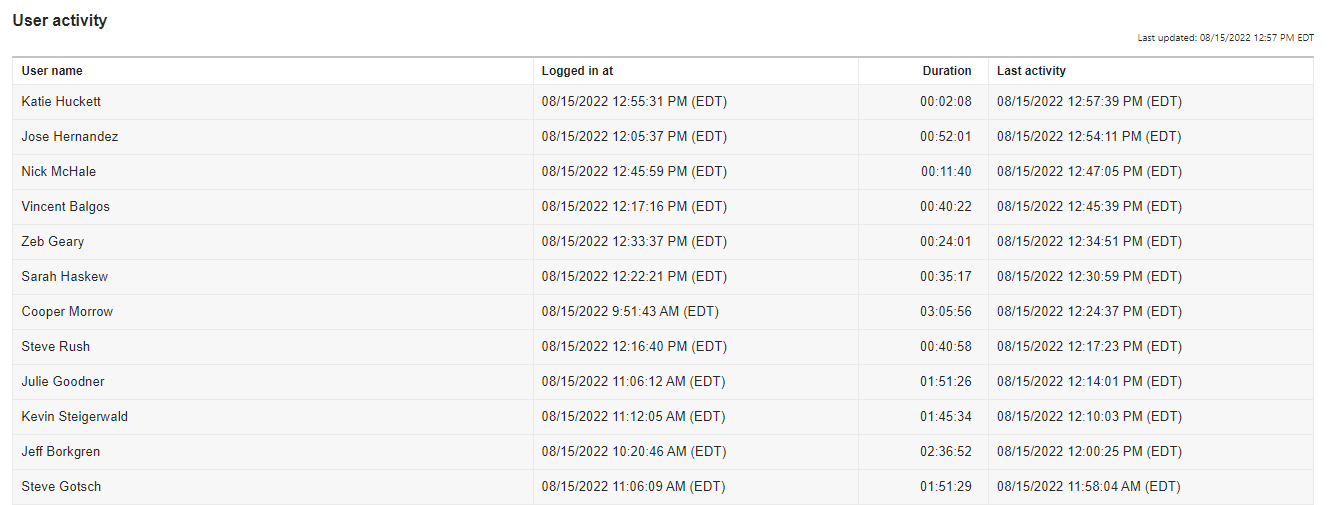
Current User Activity
The Current User Activity table displays all active logins based on the selected license type in the dropdown above the chart. For each user, the table includes:
Login Time – When the session began
Session Duration – How long the user has been logged in
Last Activity – The most recent time the system detected user activity
This data provides visibility into real-time usage and helps Admins understand how licenses are being utilized across the organization.
 Denials, Downgrades, and License Utilization Rollups
The Denials, Downgrades, and Rollups section offers key insights into license availability and user access behavior over the selected time frame. It includes:
Daily Creator Float Utilization (%):
Represents the average percentage of available creator float licenses used each day. This metric helps monitor overall license capacity and usage trends.Downgrades:
Indicates the number of users who successfully logged in but were automatically assigned a reviewer float license instead of a creator float license due to unavailability. These sessions are functional but limited to reviewer-level access.Denials:
Reflects the number of users who were unable to log in because neither creator float nor reviewer float licenses were available at the time of their login attempt.Threshold Exceedance (XX% Usage Days):
Shows how many days your organization's custom usage threshold (e.g., 85% of creator float licenses in use) was met or exceeded. This helps track high-demand days and supports informed decisions around license scaling.
These indicators support license planning, trend monitoring, and proactive decision-making to ensure adequate access for your users.
License Sessions in Jama Connect®
Float licenses are shared across a pool of Jama Connect® users, with no limit to how many users can be assigned to a floating license type. However, license consumption is managed in real time:
-
If all creator float licenses are in use, the user will either:
Receive a message stating that no licenses are available, or
Be downgraded to a reviewer float license (if reviewer floats are available).
Users who are downgraded must log out and log back in to attempt acquiring a creator float license again.
Factors Affecting License Sessions
Several factors can influence the start, continuation, or end of a user’s license session, including:
System maintenance
SAML/Auth0 SSO sessions
Browser cookie settings
Session timeout configurations
Jama Connect® sessions are governed by a system property with a default timeout value of 120 minutes (2 hours). If needed, Root Admins can use the "Log out all users" option in the Admin panel to enforce immediate license reassignments or setting changes.
How Sessions End
A session will end when:
The user is inactive for the duration of the session timeout, or
The user manually logs out.
Important: Simply closing the browser tab or window, or shutting down the machine , does not end the Connect session. The license remains in use until the session timeout is reached or the user logs out.
Working With the Usage Chart in Jama Connect®
The License Usage Chart in the Admin panel is updated in real-time based on login data. It helps administrators track and understand how float licenses are being consumed over time.
Key Features
Real-Time Data: The chart reflects up-to-date login activity.
Retention: Jama Connect® retains up to 365 days of license usage data.
Thresholds: Admins can configure a usage threshold to trigger email alerts when float license usage exceeds a set percentage.
Default View: The chart defaults to showing all license types used over the last seven days.
Filters Available: You can adjust dropdowns at the top of the chart to filter by license type (e.g., Creator float) or a different timeframe (e.g., last 30 days).
Common Questions You Can Answer Using This Chart
Downgrades
How many users have been downgraded to a review-only license?
How frequently is this happening?
Are specific users being downgraded more often than others?
Usage Trends
When is peak usage occurring? (hourly, daily, monthly)
How much time are users spending in Connect?
Are certain users spending significantly more time than others?
License Assignments & Utilization
Do I have the right mix of license types (creator vs. reviewer)?
Is my float license-to-user assignment ratio appropriate?
Do I need to plan or budget for additional licenses?
Using the Admin Page for Quick Insights
To view downgrades at a glance:
Log in to Jama Connect®.
Navigate to: Admin > License.
Set the license type dropdown to:
Creator (float).Set the timeframe dropdown to your desired duration (e.g., 7 days, 30 days).
-
Look below the chart for the second metric:
“X number of users assigned a downgraded license because a floating license was unavailable.”
This figure helps you understand how often users are being downgraded due to limited license availability.
Understanding License Usage in Jama Connect®
When Is My Peak Usage Occurring?
You can identify your organization’s peak usage days and hours using the License Usage Chart.
Steps:
Log in to Jama Connect®.
Navigate to: Admin > License.
Set the License Type dropdown to
Creator (float).Set the Timeframe dropdown to the desired duration (e.g.,
Last 90 days).-
Observe the chart line to identify peak usage days.
Example: Peak days may appear around month-end, such as 6/29–6/30 or 7/28, which could indicate an organizational trend.
-
Click on a specific day in the chart to drill into hourly usage.
Example: On 6/29, usage peaks may occur around 1:00 am and 7:00 am. These patterns can be further analyzed using the export feature for deeper insights.
Do I Have the Right Mix of Licenses?
To determine if your license-to-user ratio is optimal, review several key metrics:
Step-by-Step Evaluation:
Log in to Jama Connect®.
Navigate to: Admin > License.
Set the License Type dropdown to
All.Set the Timeframe dropdown to
Last 90 days(or another desired duration).-
Review the following metrics within and below the chart:
Login volume (number of users accessing the system)
Daily license usage % (how close usage is to 100%)
Downgrades (number of times users were downgraded to Reviewer)
Denials (number of users who could not access due to unavailable licenses)
Days above the threshold (days where license usage exceeded the configured threshold)
License-to-user ratio (available at the bottom of the license page)
Interpreting Your Metrics
| Scenario | Interpretation |
|---|---|
| High login volume, no downgrades/denials, license usage ≤100%, few or no days over threshold | Your license mix is likely optimal. |
| High login volume, no downgrades/denials, but high usage % or threshold days | You're close to capacity. Monitor this closely, but you may not need to adjust yet. |
| Frequent downgrades or denials, regardless of other metrics | You likely need to adjust your license mix. Consider purchasing additional licenses or reducing the number of assigned users. |
Analyzing Creator (Float) Licenses Specifically
Set the License Type dropdown to
Creator (float).-
Review your assigned user-to-license ratio.
Example: If you own 40 Creator (float) licenses and have 258 assigned users, your ratio is 1:6.45.
Apply the same metric evaluation process from above, focusing on Creator (float) usage only.
-
If you observe signs of strain (e.g., frequent downgrades, high denial counts), consider:
Increasing the number of Creator (float) licenses, or
Decreasing the number of assigned users to reduce the ratio.
Note: Deeper analysis is available in the Exported Data section below.
Analyzing License Usage in Excel with Exported Data
The Admin License page retains data for up to 90 days. To maintain a longer-term historical record for year-over-year analysis and to identify trends, it is recommended that license usage data be exported every 90 days and stored locally.
Steps to Export License Usage Data
Log in to Jama Connect®.
Navigate to: Admin > License.
Set the License Type dropdown to All.
Set the Timeframe dropdown to Last 90 days.
Click the Export button and save the Excel file to your local system.
Preparing the Exported Excel Data for Analysis
To analyze the exported data effectively with Excel PivotTables, follow these data sanitization steps:
- Log in to Connect > Admin > License
- Set the license type dropdown to 'All.'
- Set the timeframe dropdown to 'last 90 days.'
- Select the 'Export' button and save the Excel file locally
- Open the Excel file and perform the following data sanitization steps necessary for analyzing with PivotTables:
- Insert a new column to calculate the Duration in Milliseconds into an HH:MM:SS format
- Place your cursor in the second row of the new column and enter the following formula: =DurationInMilliseconds/86400000
- Copy the formula down the entire column
- Highlight the column and set the cell format to Time as hh:mm:ss
- Insert a new column to calculate the Duration in Milliseconds into an HH:MM:SS format
- Prepare the LoggedInAt column for the proper date and time formatting and analysis
- Highlight the entire LoggedInAt column > select Find & Select > Replace... and complete the following three Find/Replace steps:
- Find what = " UTC" (be sure to include the space before UTC) and leave the Replace with field empty > select Replace All
- Find what = " AM" (be sure to include the space before AM) and Replace with = "AM" with no space preceding
- Find what = " PM" (be sure to include the space before PM) and Replace with = "PM" with no space preceding
- The resulting columns should appear in this format: MM/DD/YYYY hh:mm:ssAM or MM/DD/YYYY hh:mm:ssPM
- With the entire LoggedInAt column still highlighted, copy and paste the data into an empty column next to it and rename the original column 'LoggedInAtUTC.' You may name the new column 'LoggedInAtDate' as we are about to split the date and time values into separate columns
- Highlight the new column 'LoggedInAtDate' and complete the following actions:
- Select the Data tab > select 'Text to Columns.'
- Step 1 of the wizard, choose 'Delimited' > Next.
- Step 2 of the wizard, choose 'Space' and ensure 'Treat consecutive delimiters as one' is checked > Next
- Step 3 of the wizard, set the first column data format to 'Date: MDY' and accept the default for the remaining columns > Finish
- Once the columns are split, highlight the 'LoggedInAtDate' column and format it as a short date (MM/DD/YYYY)
- Label the new column that contains only the time to 'LoggedInAtTimeUTC,' then highlight the entire column > select Find & Select > Replace... and complete the following two Find/Replace steps:
- Find what = "AM" with no space preceding and Replace with = " AM" (be sure to include the space before AM)
- Find what = "PM" with no space preceding and Replace with = " PM" (be sure to include the space before PM)
- With the entire 'LoggedInAtUTC' column still highlighted, format the column for Time (either 12:30:00 PM or 13:30:00)
- Highlight the entire LoggedInAt column > select Find & Select > Replace... and complete the following three Find/Replace steps:
-
(Optional) If you wish to convert the UTC to your organization's primary time zone, you may choose to add a new column for 'LoggedInAtORGTIMEZONE' with the following formula:
- If you have not yet split the date/time columns
- =datetime+(hours/24) if your timezone is ahead of UTC
- =datetime-(hours/24) if your timezone is behind UTC
- example: =E2-(7/24) --- if UTC is in cell E2 and you are converting to PDT (7 hours behind UTC)
- If you have split the date and time columns
- =MOD(datetime+(hours/24),1) if your timezone is ahead of UTC
- =MOD(DateTime-(hours/24),1) if your timezone is behind UTC
- example: =MOD(E2+(2/24),1) --- if UTC is in cell E2 and you are converting to CEST (2 hours ahead UTC)
- You may also need to review any times that crossed over to the following day (for example, 11:59 pm UTC converted to CEST would be 1:59 am, and the date would need to be adjusted accordingly)
- If you have not yet split the date/time columns
Analyzing User Downgrades to Review-Only Licenses Using Excel PivotTables
Questions to Answer:
How many users have been downgraded to a review-only license?
How frequently are users being downgraded?
Are specific users being downgraded more often than others?
Step 1: Create the PivotTable
Open your Excel file (with the previous data preparation steps completed).
Place your cursor anywhere inside the data table.
Go to the Insert tab and select PivotTable.
-
In the Create PivotTable dialog:
Confirm the Table/Range field is correctly populated.
Choose New Worksheet as the destination.
Check Add this data to the Data Model.
Click OK.
Step 2: Organize Worksheets
Rename your original worksheet to RawData to keep things organized.
Rename the new worksheet with the PivotTable to Downgrades.
Step 3: Configure the PivotTable Fields
In the PivotTable Fields pane:
-
Drag
LicenseAssignedto the Filters section.Set the filter to show only Creator (float).
-
Drag
Downgradedto the Columns section.Values:
FALSEmeans not downgraded;TRUEmeans downgraded.
-
Drag
LoggedInAtDateto the Rows section.Group these by Month for monthly downgrade trends.
-
Drag
UserNameto the Values section.By default, this shows the total count of downgrade attempts (including multiple attempts by the same user).
Step 4: Switch to Distinct User Counts (Optional)
To count unique users instead of total attempts:
Click the dropdown on the UserName field in the Values section.
Select Value Field Settings....
Scroll to the bottom and select Distinct Count.
Click OK.
Step 5: Interpret the Results
If no
TRUEcolumn appears, no users were downgraded when accessing Creator (floating) licenses.If a
TRUEcolumn exists, users were downgraded on one or more login attempts.-
Compare counts in the
TRUE(downgraded) andFALSE(not downgraded) columns:If downgrades are high relative to non-downgrades, consider evaluating your license-to-user ratio.
Step 6 (Optional): Show Downgrades as Percentages
To view downgrade counts as a percentage of total login attempts:
Click the dropdown on the UserName field in the Values section.
Select Value Field Settings....
Go to the Show Values As tab.
Choose % of Row Total from the dropdown.
Click OK.
Use this analysis to understand downgrade patterns and help make informed decisions on whether to adjust your floating license count or assigned users.
Creating a Detailed Downgrade Analysis PivotTable
Step 1: Insert a New PivotTable
Place your cursor anywhere inside the data table.
Go to the Insert tab and select PivotTable.
-
In the Create PivotTable dialog:
Confirm the Table/Range is populated.
Choose New Worksheet.
Check Add this data to the Data Model.
Click OK.
Step 2: Configure the PivotTable Fields
In the PivotTable Fields pane:
-
Drag
Downgradedto the Filters section.Set the filter to TRUE only, so you analyze only users who have been downgraded.
-
Drag
LoggedInAtDateto the Columns section.Group dates by Month if the downgrade volume is high.
Drag
UserNameto the Rows section.-
Drag
LoggedInAtTimeUTC(or your converted local time field) below the UserName field in the Rows section.This adds a time-level detail beneath each user to see when downgrades occur.
-
Drag
UserNameagain to the Values section.This counts the number of downgrade events each user has.
Step 3: Evaluate the PivotTable
Review the list of UserNames to identify which users are downgraded.
Verify if specific users have multiple downgrade entries, indicating a history of frequent issues.
-
Examine the Dates and Times of the downgrades:
Are downgrades clustered on particular days or even within short periods?
This can reveal patterns such as system issues or peak usage times.
Example Insight
In the example below, three different users were downgraded on the same day, within 15 seconds of each other — potentially signaling a shared event or system bottleneck.
Analyzing Peak Usage and User Activity in Jama Connect® with Excel PivotTables
Questions to Answer:
When is peak usage occurring (hourly, monthly, yearly)?
How much time are users spending in Connect?
Are there specific users spending significantly more time than others?
Step 1: Insert a New PivotTable
Open your Excel file and navigate to the RawData sheet.
Place your cursor anywhere inside the data table.
Go to the Insert tab and select PivotTable.
-
In the Create PivotTable dialog:
Confirm the Table/Range is populated.
Choose New Worksheet as the destination.
Check Add this data to the Data Model.
Click OK.
Step 2: Rename the Worksheet
Rename the new worksheet to Usage.
Step 3: Configure the PivotTable Fields
In the PivotTable Fields pane:
-
Drag
LicenseAssignedto the Filters section.Set the filter to show Creator (float) licenses only.
-
Drag
LoggedInAtDateto the Columns section.Group these by Month to analyze monthly trends.
-
Drag
LoggedInAtTimeUTC(or your local time equivalent) to the Rows section.Group these by Hour to analyze hourly trends.
-
Drag
UserNameto the Values section.By default, this shows the total count of logins (which may include multiple logins per user).
Step 4: Switch to Distinct User Counts (Optional)
To view the number of unique users instead of total logins:
Click the dropdown on the UserName field in the Values section.
Select Value Field Settings....
Scroll to the bottom and choose Distinct Count.
Click OK.
Step 5: Evaluate the PivotTable
Identify which months (columns) had the highest volume of logins or unique users.
Identify peak hours throughout the day (rows).
If you have not converted from UTC to your local time, note the time zone next to your analysis for clarity.
-
Example insights from analysis may include:
Peak usage occurs during specific months, e.g., May–July, with a drop-off in August.
Peak hours are typically between 8:00 AM and 10:00 AM local time.
Historical data can reveal yearly trends to help plan for expected peak loads.
Step 6: Using Historical Data for Planning
Export license usage data every 90 days to maintain historical records.
Compare data year-over-year to identify consistent trends.
Use this information to proactively inform teams about potential peak periods and plan for resource needs or possible license downgrades during those times.
Evaluating Maximum Session Duration Per User in Jama Connect®
Goal: Identify users who may be monopolizing Creator (float) licenses by analyzing their longest login sessions.
Step 1: Create a New PivotTable
Open your Excel file and navigate to the RawData sheet.
Place your cursor anywhere within the data.
Go to the Insert tab and click PivotTable.
-
In the Create PivotTable dialog:
Ensure the Table/Range field is populated.
Select New Worksheet for the location.
Check Add this data to the Data Model.
Click OK
Step 2: Rename Worksheet
Rename the new worksheet to UserDuration.
Step 3: Configure PivotTable Fields
In the PivotTable Fields pane:
-
Drag
LicenseAssignedto the Filters section.Filter to Creator (float) licenses only.
-
Drag
LoggedInAtDateto the Columns section.Group the dates by Month.
Drag
UserNameto the Rows section.-
Drag
DurationTime(or equivalent field representing session duration) to the Values section.Click the dropdown arrow on the DurationTime field.
Select Value Field Settings....
Under the 'Summarize value field by' option, select 'Max'.
Click OK
Step 4: Sort PivotTable
Sort the PivotTable in Descending order by Max of DurationTime to see users with the most extended sessions at the top.
Step 5 (Optional): Calculate Average Max Duration Excluding Outliers
-
To the right of the PivotTable, in an empty cell, enter a formula to sum all Max Durations except the highest and lowest values to exclude outliers.
Example:
=SUM(F6:F2389)(Adjust cell range to your data).
-
Below that cell, calculate the average max duration by dividing the total by the number of users.
Example:
=AVERAGE(G6/2380)(adjust as needed).
This provides a more accurate representation of typical maximum session lengths, without extreme outliers skewing the results.
Step 6: Analyze Results
Review the top users with the longest max duration login sessions.
Users with significantly long sessions may be monopolizing Creator (float) licenses.
-
Cross-reference with downgrade metrics:
If frequent downgrades occur, consider assigning named Creator licenses to these heavy users.
This can free up floating licenses and reduce downgrade issues for others.
Assessing Your License Mix and Planning Future Needs
After completing the analyses outlined above, you should have a comprehensive view of your organization’s license usage patterns and user behavior. This insight will help you answer key questions such as:
Do I have the right mix of license types?
Is the ratio of owned licenses to assigned users appropriate?
Do I need to plan or budget for purchasing additional licenses?
By combining usage trends, downgrade and denial rates, and session duration data, you can make informed decisions to optimize your license allocation, improve user experience, and plan proactively for future growth.
Additional Resources
Feedback:
We welcome your input! Please sign in to leave any comments, suggestions, or improvement ideas below.
Comments
0 comments
Article is closed for comments.